`
| |
|
Archive for the ‘Metrics’ Category
Sunday, April 17th, 2011
Better productivity and collaboration via
improved feedback and high-quality information.
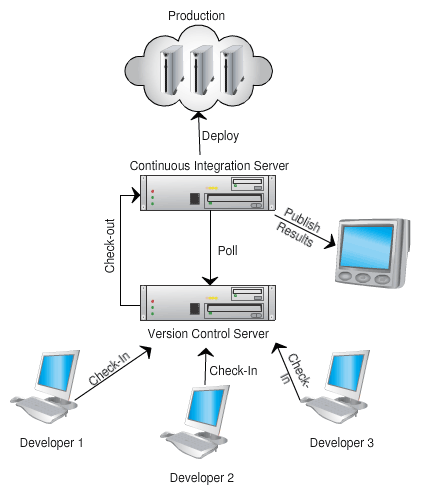
- Encourages an Evolutionary Design and Continuous Improvement culture
- On complex projects, forces a nicely decoupled design such that each modules can be independently tested. Also ensures that in production you can support different versions of each module.
- Team takes shared ownership of their development and build process
- The source control trunk is in an always-working-state (avoid multiple branch issues)
- No developer is blocked because they can’t get stable code
- Developers break down work into small end-to-end, testable slices and checks-in multiple times a day
- Developers are up-to date with other developer changes
- Team catches issues at the source and avoids last minute integration nightmares
- Developers get rapid feedback once they check-in their code
- Builds are optimized and parallelized for speed
- Builds are incremental in nature (not big bang over-night builds)
- Builds run all the automated tests (may be staged) to give realistic feedback
- Captures and visualizes build results and logs very effectively
- Display various source code quality metrics trends
- Code coverage, cyclomatic complexity, coding convention violation, version control activity, bug counts, etc.
- Influence the right behavior in the team by acting as Information Radiator in the team area
- Provide clear visual feedback about the build status
- Developers ask for an easy way to run and debug builds locally (or remotely)
- Broken builds are rare. However broken builds are rapidly fixed by developers
- Build results are intelligently archived
- Easy navigation between various build versions
- Easily visualization and comparison of the change sets
- Large monolithic builds are broken into smaller, self contained builds with a clear build promotion process
- Complete traceability exists
- Version Control, Project & Requirements Managements tool, Bug Tracking and Build system are completely integrated.
- CI page becomes the project dashboard for everyone (devs, testers, managers, etc.).
Any other impact you think is worth highlighting?
Posted in Agile, Continuous Deployment, Metrics, Organizational | No Comments »
Tuesday, February 1st, 2011
I once worked for a manager (a.k.a Scrum Master) who insisted that we should have at least 85% code coverage on our project. If we did not meet the targeted coverage numbers this sprint, then the whole team would face the consequences during the upcoming performance appraisals. In spite of trying to talk to her, she insisted. I would like to believe that the manager had good intent and was trying to encourage developers to write clean, tested code.
However the ground reality was, my colleagues were not convinced about automated developer testing, they lacked basic knowledge and skill to do effective developer testing and the manager always kept them under high pressure. (Otherwise people would slack, she said.)
Now what do you expect to happened when managers push certain (poorly understood) metric down developers’ throats?
Humans are very good at gaming systems and they do a wonderful job.
- Some developers wrote automated tests with ZERO assert statements
- Others wrote complex, fragile test code which was an absolute maintenance nightmare. Their coverage numbers looked impressive.
- Me and my pair wrote a small test which would simply crawl all the code base. We were able to achieve 99% code coverage. (1% intensionally left, so we don’t look suspicious.)
- And so on…
The manager was very happy and so was the team. This went on for some sprints. One could find our manager showing off to her colleagues about how much the team respected her words and what a command she had on us.
Alas, her happiness lasted only for a few sprints. One fine Sprint demo day, I convinced the team to showcase our dirty little secret to all the stakeholders and management.
The event did shake up the management. It also sent out a clear message.
Code Coverage measures which line of code got executed (intensionally or accidentally) when you run the program or tests against the program. Code coverage tells you nothing about the quality of your tests, hence nothing about the quality of the code. Code coverage along with Cyclomatic Complexity can be used by the team to guide them, but not by management to judge the team.
Posted in Agile, Metrics, Organizational | 1 Comment »
Friday, January 21st, 2011
The fundamental attribution error (AKA correspondence bias/attribution effect) describes the tendency to over-value dispositional or personality-based explanations for the observed behaviors of others while under-valuing situational explanations for those behaviors.
For example, if Alice saw Bob trip over a rock and fall, Alice might consider Bob to be clumsy or careless (dispositional). If Alice later tripped over the same rock herself, she would be more likely to blame the placement of the rock (situational).
(Shameless rip-off from Wikipedia)
The funny part is, this error only occurs when we observe other’s behavior. We rarely apply fundamental attribution error to ourselves.
All of us are victims to this behavior daily. As Management, Coaches or Consultants, we need to be extra careful. Its easy to judge a team/company based on our personal explanation for the observed behavior and ignore the situational explanation.
For example, if a team of developers don’t meet their estimates, we might conclude that the developers are inexperienced and have not spent enough time estimating. They need to spend more time estimating, to get better at it. But if we look at the situational explanations, the developers don’t really understand what needs to be built, the person requesting for the feature is not clear what they expect, there might be a huge variety of ways in which the problem could be solved and so on. If we switch roles and try to play the developer’s role, we might be able to understand the situational/contextual explanation for the observed behavior.
I also see many people attribute poor team/company performance to lack of “Agile process”. They bring in the trainers and the coaches, who train and coach the team with standard “Agile practices”. Months/Years later, the team (what ever is left) have got good with process, but the product does not pull its weight and eventually dies out.
Fundamental Attribution Error is another reason why we see such vast spread abuse of Metrics in every field.
So how do we deal with this?
And I hear the Lean Extremists scream, 5 Whys…5 Whys…
Based on my personal experience, 5 Whys can also suffers from the same problem of Fundamental Attribution Error.
Being aware of the fundamental attribution error and other concepts like actor–observer bias and other forms of bias can help.
And in some cases, trial and error (brute force) seems to be the only answer.
Posted in Agile, Coaching, Cognitive Science, Metrics | 1 Comment »
Tuesday, August 31st, 2010
What tools do you use for Code Analysis of C/C++ projects?
This is a common questions a lot of teams have when we discuss Continuous Integration in C/C++.
I would recommend the following tools:
UPDATE: I strongly recommend looking at CppDepend (commercial), one stop solution for all kinds of metric. It has some very cool/useful features like Code Query Language, Customer Build Reporting, Comparing Builds, great visualization diagrams for dependency, treemaps, etc.
- Cyclomatic Complexity
- Code Coverage
- LOC Metric
- Most of the tools listed above would give you this measure
- LC2 – Open Source
- CNCC – Open Source
- Copy Paste Detector – PMD – Open Source
Wikipedia page on Static Code Analysis Tools has a list of many more tools.
Posted in Agile, Metrics, Tools | 1 Comment »
Tuesday, August 11th, 2009
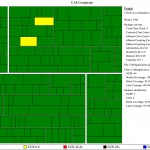
I’ve become a big fan of displaying metric using Treemaps. Julias Shaw‘s Panpoticode is a great tool to produce useful design metric in the treemap format for your Java project.
In the past, I’ve used these graphs to show Before and After snapshots of various projects after a small refactoring effort. In this blog I want to show you a healthy project’s codebase and highlight somethings that makes me feel comfortable about the codebase. (Actually there is not much to talk, a picture is worth a thousand words.)
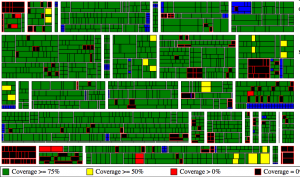
Following is the code coverage report from a project:
Couple of quick observations:
- Majority of the code has coverage over 75% (Our goal is not to have every single class with 100% code coverage. Code Coverage does not talk about Quality of your tests.)
- There is a decent distribution of code across packages, classes and methods. (No large boxes standing out.)
- You don’t see large black patches (ones you see are classes that were mocked out for testing).
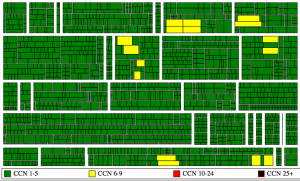
Lets look at the complexity graph:
- Except for a couple of methods, most of them have Cyclomatic Complexity under 5.
- You don’t see large red or black boxes which are clear indicators of complex code.
Panopticode combined with CheckStyle, FindBugs and JDepends can give you a lot more info to check the real pulse of your codebase.
Posted in Agile, Design, Metrics, Programming, Testing, Tools | 2 Comments »
Monday, February 9th, 2009
Some time back, I spent 1 Week helping a project (Server written in Java) clear its Technical Debt. The code base is tiny because it leverages lot of existing server framework to do its job. This server handles extremely high volumes of data & request and is a very important part of our server infrastructure. Here are some results:
| Topic |
Before |
After |
| Project Size |
Production Code
- Package =1
- Classes =4
- Methods = 15 (average 3.75/class)
- LOC = 172 (average 11.47/method and 43/class)
- Average Cyclomatic Complexity/Method = 3.27
Test Code
- Package =0
- Classes = 0
- Methods = 0
- LOC = 0
|
Production Code
- Package = 4
- Classes =13
- Methods = 68 (average 5.23/class)
- LOC = 394 (average 5.79/method and 30.31/class)
- Average Cyclomatic Complexity/Method = 1.58
Test Code
- Package = 6
- Classes = 11
- Methods = 90
- LOC =458
|
| Code Coverage |
- Line Coverage: 0%
- Block Coverage: 0%

|
- Line Coverage: 96%
- Block Coverage: 97%
|
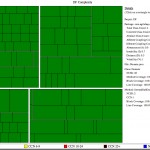
| Cyclomatic Complexity |
 |
 |
| Obvious Dead Code |
Following public methods:
- class DatabaseLayer: releasePool()
Total: 1 method in 1 class |
Following public methods:
- class DFService: overloaded constructor
Total: 1 method in 1 class
Note: This method is required by the tests. |
| Automation |
|
|
| Version Control Usage |
- Average Commits Per Day = 0
- Average # of Files Changed Per Commit = 12
|
- Average Commits Per Day = 7
- Average # of Files Changed Per Commit = 4
|
| Coding Convention Violation |
96 |
0 |
Another similar report.
Posted in Agile, Coaching, Design, Metrics, Planning, Programming, Testing, Tools | No Comments »
Monday, February 2nd, 2009
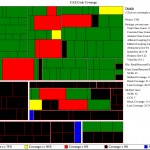
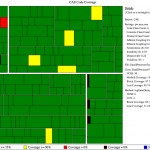
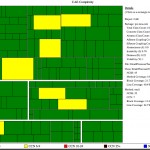
Recently I spent 2 Weeks helping a project clear its Technical Debt. Here are some results:
| Topic |
Before |
After |
| Project Size |
Production Code
- Package = 7
- Classes = 23
- Methods = 104 (average 4.52/class)
- LOC = 912 (average 8.77/method and 39.65/class)
- Average Cyclomatic Complexity/Method = 2.04
Test Code
- Package = 1
- Classes = 10
- Methods = 92
- LOC = 410
|
Production Code
- Package = 4
- Classes = 20
- Methods = 89 (average 4.45/class)
- LOC = 627 (average 7.04/method and 31.35/class)
- Average Cyclomatic Complexity/Method = 1.79
Test Code
- Package = 4
- Classes = 18
- Methods = 120
- LOC = 771
|
| Code Coverage |
- Line Coverage: 46%
- Block Coverage: 43%
|
- Line Coverage: 94%
- Block Coverage: 96%
|
| Cyclomatic Complexity |
 |
 |
| Obvious Dead Code |
Following public methods:
- class CryptoUtils: String getSHA1HashOfString(String), String encryptString(String), String decryptString(String)
- class DbLogger: writeToTable(String, String)
- class DebugUtils: String convertListToString(java.util.List), String convertStrArrayToString(String)
- class FileSystem: int getNumLinesInFile(String)
Total: 7 methods in 4 classes |
Following public methods:
- class BackgroundDBWriter: stop()
Total: 1 method in 1 class
Note: This method is required by the tests. |
| Automation |
|
|
| Version Control Usage |
- Average Commits Per Day = 1
- Average # of Files Changed Per Commit = 2
|
- Average Commits Per Day = 4
- Average # of Files Changed Per Commit = 9
Note: Since we are heavily refactoring, lots of files are touched for each commit. But the frequency of commit is fairly high to ensure we are not taking big leaps. |
| Coding Convention Violation |
976 |
0 |
Something interesting to watch out is how the production code becomes more crisp (fewer packages, classes and LOC) and how the amount of test code becomes greater than the production code.
Another similar report.
Posted in Agile, Coaching, Design, Metrics, Programming, Testing, Tools | 4 Comments »
Wednesday, June 21st, 2006
What is the purpose of Continuous Integration (CI)?
To avoid last minute integration surprises. CI tries to break the integration process into small, frequent steps to avoid big bang integration as it leads to integration nightmare.
If people are afraid to check-in frequently, your Continuous Integration process is not working.
CI process goes hand in hand with Collective Code Ownership and Single-Team attitude.
CI is the manifestation of “Stop the Line” culture from Lean Manufacturing.
What are the advantages of Continuous Integration?
- Helps to improve the quality of the software and reduce the risk by giving quicker feedback.
- Experience shows that a huge number of bugs are introduced during the last-minute code integration under panic conditions.
- Brings the team together. Helps to build collaborative teams.
- Gives a level of confidence to checkin code more frequently that was once not there.
- Helps to maintain the latest version of the code base in always shippable state. (for testing, demo, or release purposes)
- Encourages lose coupling and evolutionary design.
- Increase visibility and acts as an information radiator for the team.
- By integrating frequently, it helps us avoid huge integration effort in the end.
- Helps you visualize various trends about your source code. Can be a great starting point to improve your development process.
Is Continuous Integration the same as Continuous build?
No, continuous build only checks if the code compiles and links correctly. Continuous Integration goes beyond just compiling.
- It executes a battery of unit and functional tests to verify that the latest version of the source code is still functional.
- It runs a collection of source code analysis tools to give you feedback about the Quality of the source code.
- It executes you packing script to make sure, the application can be packaged and installed.
Of course, both CI and CB should:
- track changes,
- archive and visualize build results and
- intelligently publish/notify the results to the team.
How do you differentiate between Frequent Versus Continuous Integration?
Continuous means:
- As soon as there is something new to build, its built automatically. You want to fail-fast and get this feedback as rapidly as possible.
- When it stops becoming an event (ceremony) and becomes a behavior (habit).
Merge a little at a time to avoid the big cost at full integration at the end of a project. The bottom line is fail-fast & quicker feedback.
Can Continuous Integration be manual?
Manual Continuous Integration is the practice of frequently integrating with other team members’ code manually on developer’s machine or an independent machine.
Because people are not good at being consistent and cannot do repetitive tasks (its a machine’s job), IMHO, this process should be automated so that you are compiling, testing, inspecting and responding to feedback.
What are the Pre-Requisites for Continuous Integration?
This is a grey area. Here a quick list is:
- Common source code repository
- Source Control Management tool
- Automated Build scripts
- Automated tests
- Feedback mechanism
- Commit code frequently
- Change of developer mentality, .i.e. desire to get rapid feedback and increase visibility.
What are the various steps in the Continuous Integration build?
- pulling the source from the SCM
- generating source (if you are using code generation)
- compiling source
- executing unit tests
- run static code analysis tools – project size, coding convention violation checker, dependency analysis, cyclomatic complexity, etc.
- generate version control usage trends
- generate documentation
- setup the environment (pre build)
- set up third party dependency. Example: run database migration scripts
- packaging
- deployment
- run various regression tests: smoke, integration, functional and performance test
- run dynamic code analysis tools – code coverage, dead-code analyzer,
- create and test installer
- restore the environment (post build)
- publishing build artifact
- report/publish status of the build
- update historical record of the build
- build metrics – timings
- gather auditing information (i.e. why, who)
- labeling the repository
- trigger dependent builds
Who are the stakeholders of the Continuous Integration build?
- Developers
- Testers [QA]
- Analysts/Subject Matter Experts
- Managers
- System Operations
- Architects
- DBAs
- UX Team
- Agile/CI Coach
What is the scope of QA?
They help the team with automating the functional tests. They pick up the product from the nightly build and do other types of testing.
For Ex: Exploratory testing, Mutation testing, Some System tests which are hard to automate.
What are the different types of builds that make Continuous Integration and what are they based on?
We break down the CI build into different builds depending on their scope & time of feedback cycle and the target audience.
1. Local Developer build :
1.a. Job: Retains the environment. Only compiles and tests locally changed code (incremental).
1.b. Feedback: less than 5 mins.
1.c. Stakeholders: Developer pair who runs the build
1.d. Frequency: Before checking in code
1.e. Where: On developer workstation/laptop
2. Smoke build :
2.a. Job: Compiles , Unit test , Automated acceptance and Smoke tests on a clean environment[including database].
2.b. Feedback: less than 10 to 15 mins. (If it takes longer, then you could make the build incremental, not start on a clean environment)
2.c. Stakeholders: All the developers within a single team.
2.d. Frequency: With every checkin
2.e. Where: On a team’s dedicated continuous integration server. [Multiple modules can share the server, if they have parallel builds]
3. Functional build :
3.a. Job: Compiles , Unit test , Automated acceptance and All Functional\Regression tests on a clean environment. Stubs/Mocks out other modules or systems.
3.b. Feedback: less than 1 hour.
3.c. Stakeholders: Developers , QA , Analysts in a given team
3.d. Frequency: Every 2 to 3 hours
3.e. Where: On a team’s dedicated continuous integration server.
4. Cross module build :
4.a. Job: If your project has multiple teams, each working on a separate module, this build integrates those modules and runs the functional build across all those modules.
4.b. Feedback: in less than 4 hr.
4.c. Stakeholders: Developers , QA , Architects , Manager , Analyst across the module team
4.d. Frequency: 2 to 3 times a day
4.e. Where: On a continuous integration server owned by all the modules. [Different from above]
5. Product build :
5.a. Job: Integrates all the code that is required to create a single product. Nothing is mocked or stubbed. [Except things that are not yet built]. Creates all the artifacts and publishes a deployable product.
5.b. Feedback: less than 10 hrs.
5.c. Stakeholders: Every one including the Project Management.
5.d. Frequency: Every night.
5.e. Where: On a continuous integration server owned by all the modules. [Same as above]
General Rule of Thumb: No silver bullet. Adapt your own process/practice.
Posted in Agile, Continuous Deployment, Learning, Metrics, Organizational | No Comments »
|


